
Mapping exposure of marine megafauna to anthropogenic threats in the north-west marine region of Australia
About the project - Satellite tracking data - Threat analysis - Results so far - Importance of the project - Detailed methods - Acknowledgements - References
About the project
Many of the world’s species have been negatively impacted directly or indirectly by human caused deterioration of the environment and many are classified as threatened or endangered. This is also the case in marine environments, where many species are exposed to an increasing number and intensity of threats. These are increasing as human use of both coastal and offshore environments expands with our population and the related increase in need for resources from the sea (e.g oil and gas, fish) and the shipping of those resources around the world. For example, underwater noise from ship engines and from oil and gas exploration and extraction has been shown to affect many marine mammals by disrupting their communication and potentially causing hearing damage. Increasing shipping traffic not only elevates noise levels in the ocean but also places many threatened marine species such as whales and whale sharks at risk of collisions. Artificial light at night in coastal (e.g. ports, urban development) and offshore (oil and gas platforms, ships) environments can attract some species and disrupt their natural behaviour and expose them to many threats such as increases in predation and exposure to oil and other chemicals. And lastly, depletion of fish stocks, incidental entanglement in fishing gear and marine debris are potential threats from the fishing industry.
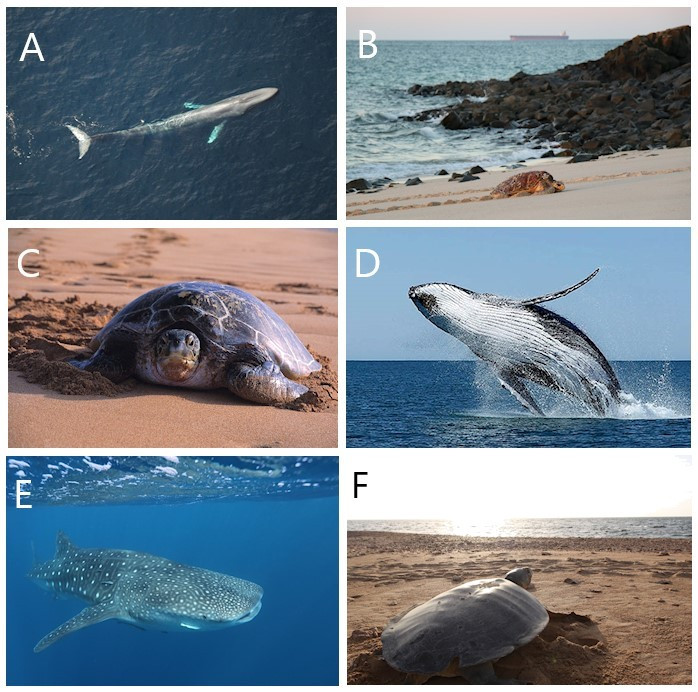
Watch the animation to see where tagged animals went: flatback turtles (green), green turtles (dark purple), hawksbill turtles (light purple), humpback whales (orange), pygmy blue whale (blue) and whale sharks (grey).
To understand the risk to these species from these threats, identification of the areas they use and the area where threats occur is needed and that’s what we aimed to do in this project. We used data from satellite telemetry tags attached to six species of threatened and migratory marine megafauna across three taxonomic groups (marine turtles, whales and sharks) off the coast of north-western Australia to map their areas of use. We then compiled spatial data from a range of threats and overlayed species and threat maps to assess the level of exposure of the species to threats. In doing so we can identify areas where there is high exposure of species to threats, where risk assessments can be best directed with resulting management actions if needed in order to protect these species.
Marine megafauna satellite tracking data
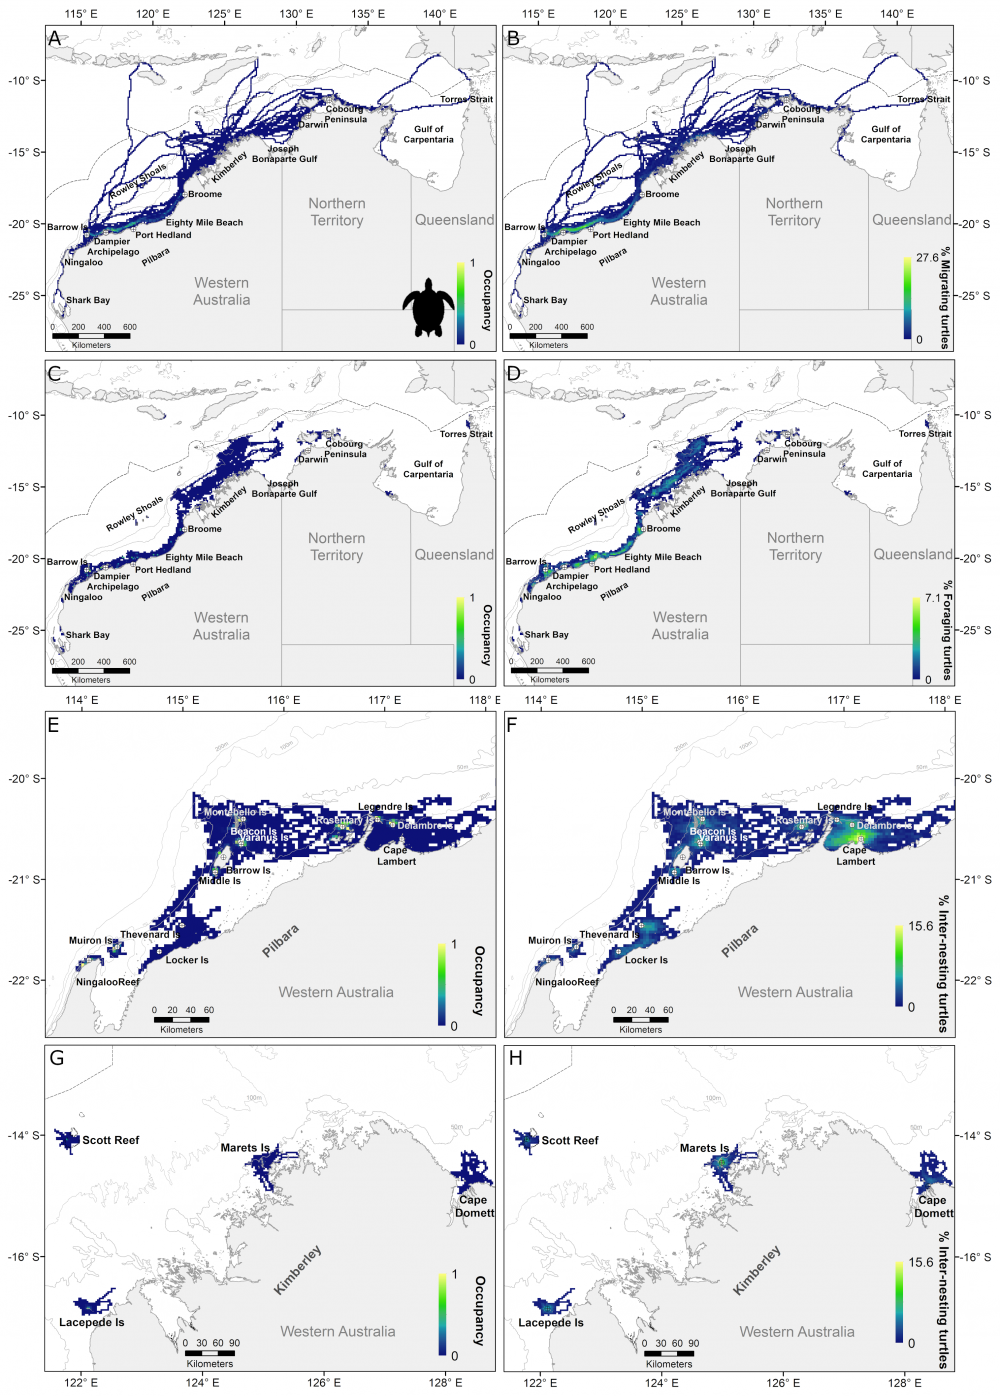
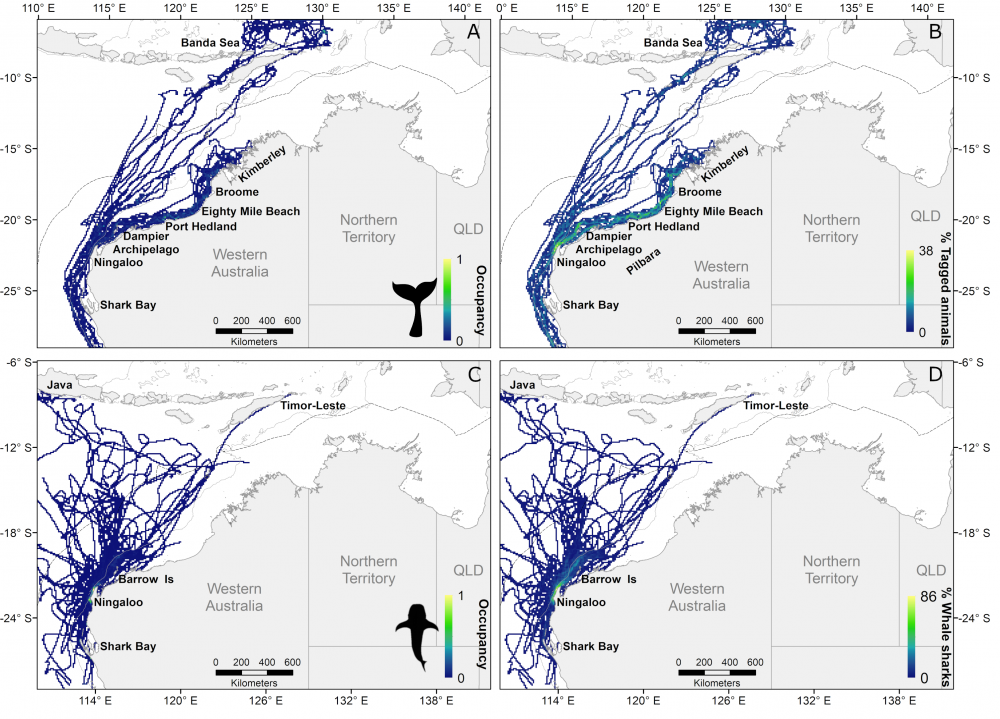
Satellite telemetry tags can provide the necessary data for many species, but these tags are costly and difficult to attach to the animals and as such the number of animals that have been tagged by individual studies is usually low. However, over the years there have now been many tracking projects and so it is now possible to compile that data to get the amount of data needed to confidently map their use of areas of interest; the North West Marine Region (NWMR) in this case. Thus, the focus species for the study were those where existing satellite tag data was available. AIMS collaborated with DBCA, the Oil and Gas Industry and a range of researchers to compile their tracking data with existing satellite tracking data for threatened marine megafauna off the coast of north-western Australia. This included 96 green (Chelonia mydas), 42 hawksbill (Eretmochelys imbricata), and 77 flatback turtles (Natator depressus); 19 humpback (Megaptera novaeangliae), and 20 pygmy blue whales (Balaenoptera musculus brevicauda); and 56 whale sharks (Rhincodon typus). To identify spatial areas that the species use (distribution) and areas of highest use, we gridded the study area using a 10 × 10 km square grid and calculated the time spent by each of the species in each grid cell. We call this metric “occupancy”. We did this because the areas where they spend the most time (high occupancy) are likely to be where they undertake important behaviours such as feeding and breeding. Please see https://northwestatlas.org/nwa/nws2s-megafauna to see the details of how we identified the most important areas. We did these analyses for each taxa group: marine turtles (Maps 1, 2, 3), whales (Map 4) and whale sharks (Map 5). For turtles we did this for each of the main phases of the turtle cycle separately, i.e., the area they use during the breeding season (inter-nesting), the migration to foraging grounds and the area used during foraging. Please see https://northwestatlas.org/nwa/nws2s-megafauna to see the details of this analysis.
We also calculated the percentage of species that used each grid cell, as the grid cells used by the most species is also a way for us to understand what are the most important areas. The top 50% of cells that had the most species and where the species spent most of the time we refer to as the core areas or the 50% utilisation distribution (UD). We did these analyses for each species and all species combined.
Threat analysis
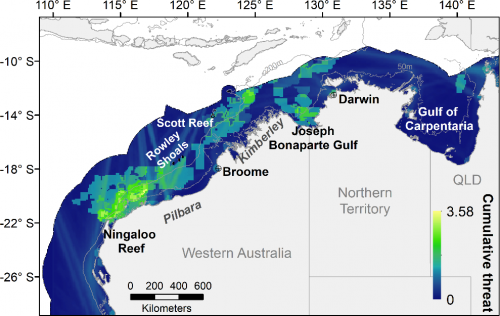
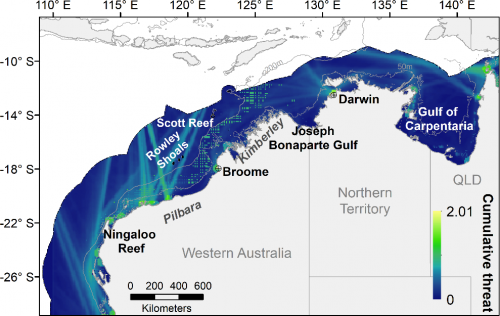
We compiled available spatial data on a range of threats in north-west Australian waters (Table 1) to assess cumulative exposure of megafauna to these threats. We did this by overlaying the spatial layer of all activities related to each threat and summing their intensity (Table 1, Maps 6, 7, 8, 9, 10, 11, 12). For example, the layer for oil spill threat (Map 6) was created by overlaying spatial layers: oil and gas structure, offshore oil and gas platforms, active petroleum titles, 2020 petroleum acreage releases, shipping and ports (Table 1). Spatial overlap between marine megafauna taxa and cumulative threat layers was used to estimate and map the exposure intensity in each grid cell.
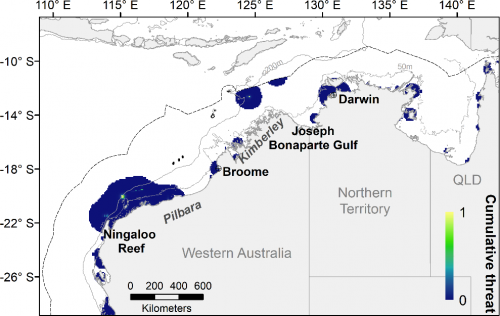
We then ranked all grid cells from highest to lowest, split the cells encompassing the top 50% (i.e. high exposure) from the bottom 50% to define management priority areas and risk areas (Maps 13, 14, 15, 16, 17). The former is where high exposure to threats suggests management is needed and the latter is where exposure to threats is lower but taxa may still be exposed to multiple threats.
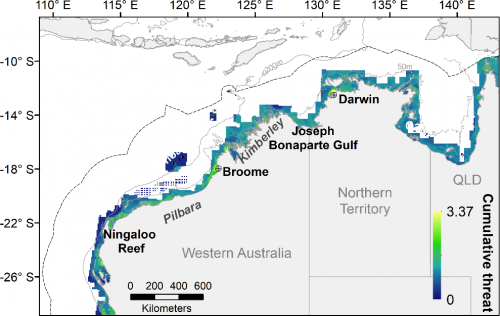

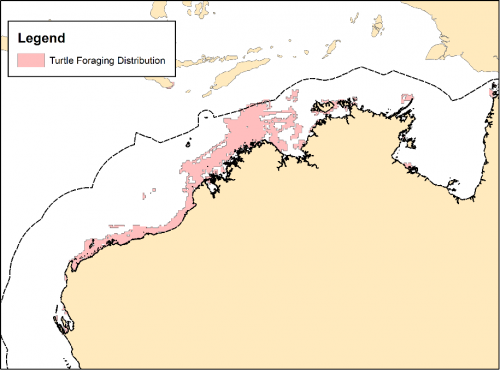
Map 13 - Exposure of marine turtles to cumulative threats during foraging. Red areas indicate management priority areas, where there is high exposure to threats (top 50% of cells) and orange areas show risk areas within the whole turtle foraging distribution where exposure to threats exist but are lower (bottom 50% of cells).
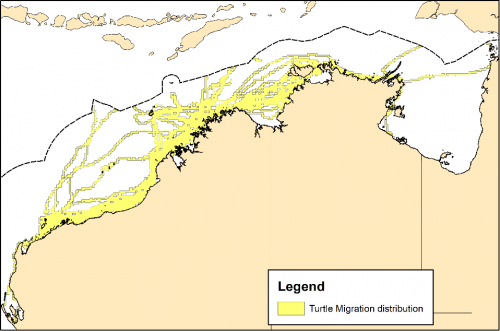
Map 14 - Exposure of marine turtles to cumulative threats during migration. Dark yellow areas indicate management priority areas, where there is high exposure to threats (top 50% of cells) and light yellow areas show risk areas within the whole turtle migration distribution where exposure to threats exist but are lower (bottom 50% of cells).
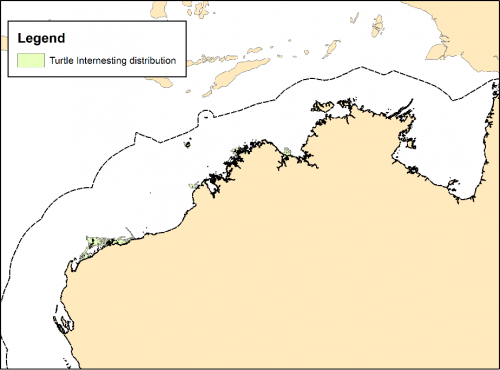
Map 15 - Exposure of marine turtles to cumulative threats during inter-nesting. Dark green areas indicate management priority areas, where there is high exposure to threats (top 50% of cells) and light green areas show risk areas within the whole turtle inter-nesting distribution where exposure to threats exist but are lower (bottom 50% of cells).
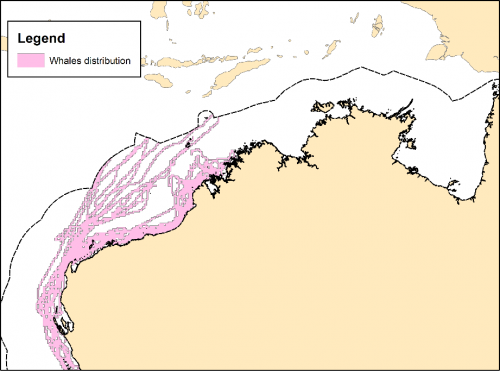
Map 16 - Exposure of whales to cumulative threats. Purple areas indicate management priority areas, where there is high exposure to threats (top 50% of cells) and pink areas show risk areas within the whole whale distribution where exposure to threats exist but are lower (bottom 50% of cells).
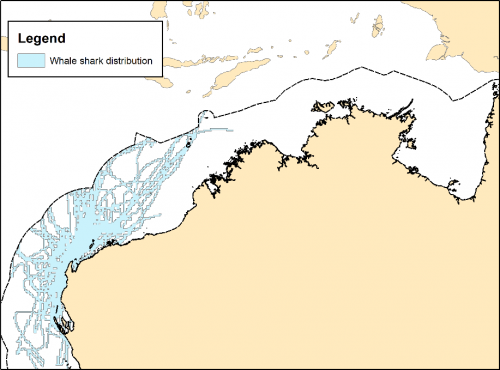
Map 17 - Exposure of whale sharks to cumulative threats. Dark blue areas indicate management priority areas, where there is high exposure to threats (top 50% of cells) and light blue areas show risk areas within the whole whale shark distribution where exposure to threats exist but are lower (bottom 50% of cells).
Marine megafauna distributions
All taxa were distributed throughout the study area off north-western Australia, from shallow coastal waters to offshore oceanic areas (Maps 1-5). Distributions of marine turtles during migration and foraging largely occurred over continental shelf waters (< 200 m; Map 1), however, foraging was mostly concentrated in waters < 100 m (mean water depth 54.8 ±37.6 m; Figure 1a-c). Only limited migratory movements occurred in oceanic areas (water depths >200 m; Map2) or outside the Australian EEZ (Figure 1A & B). Areas of highest occupancy (> 0.5) during migration mostly occurred in coastal waters off mainland Australia (Figure 1) in the Pilbara region and near the nesting sites from where turtles departed (Figure 1A-B). Areas of highest occupancy (> 0.5) during foraging occurred as discrete grid cells dispersed along coastal waters (Figure 1C-D). The distributions based on the number of turtles were larger compared to areas with high occupancy (≥ 0.5) (Figure 1b, d). During inter-nesting, high use areas (occupancy ≥ 0.5) occurred adjacent to the nesting beaches (Figure 1E-G, Map 3) with a large percentage of inter-nesting turtles (> 50%) dispersed over larger areas (Figure 1F-H).
There was a clear distinction between use of coastal and oceanic habitats by whales (Figure 2A-B, Map 4) that was driven by species, with humpbacks mostly using coastal and shelf habitats whereas pygmy blue whales predominantly used oceanic and shelf edge habitats . The waters off Ningaloo Reef were an area of high use with high occupancy (Figure 2A) and percentage of whales (Figure 2B). Areas with high percentages of whales in a grid cell also occurred along the continental shelf and shelf edge of north-western Australia and in a few discrete areas off the shelf (Figure 2a-b). High occupancy (Figure 2C) and percentage of individual whale sharks occurred off Ningaloo Reef where most shark were tagged (Map 5), with the largest percentage of sharks (> 40%) found in offshore and shelf waters from Ningaloo Reef to Barrow Island (Figure 2D).
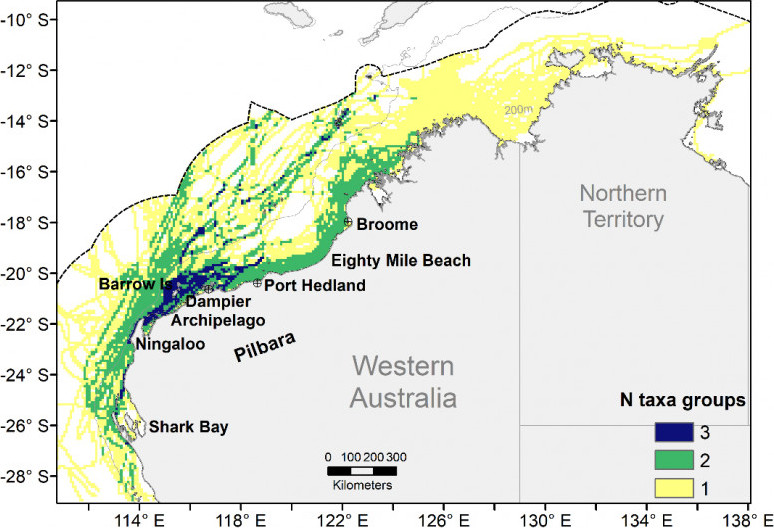
Distributions of megafauna extended throughout the Australian EEZ and beyond (Figure 1 and Figure 2, Maps 1-5), overlapping with all threats (Maps 6-12). All three taxa groups overlapped between Ningaloo Reef and Port Hedland in continental shelf waters, and in offshore waters between 117°E and Scott Reef (122°E) (Figure 3).
Areas of high exposure to threats for all taxa were largely concentrated in coastal waters (< 200m deep) of north-western Australia but also extended to offshore waters (> 200m deep) across the Northwest Marine Bioregion (Maps 13-17), reflecting the patterns seen for taxa distribution and cumulative threats.
For marine turtles, management priority areas were concentrated near the coast as small cores during foraging (Map 13) and interesting (Map 15), but as a large continuous area during migration (Map 14). Management priority areas within the distribution of whales (Map 16) extended from Ningaloo Reef to Dampier Archipelago encompassing both coastal and oceanic waters. For whale sharks, management priority areas were located near Ningaloo Reef region extending offshore of Barrow Island (Map 17).
Not surprisingly, management priority areas for coastal species (foraging and nesting turtles, and humpback whales) were found in shallow areas near large cities, ports and fishing areas. But even large sections of management priority areas for taxa that display offshore migratory movements (migratory turtles and pygmy blue whales) were found on the shelf, particularly near Ningaloo Reef, highlighting the importance of considering coastal pressures to marine megafauna.
The importance of our project
This analysis identified areas within marine megafauna distributions of high exposure to threats where risk assessments and management can be best directed. Our results can inform environmental impact assessment and decision-making related to environmental management in Australia.
Detailed methods
Tracking data - Threat data - Results
Marine megafauna satellite tracking data
Satellite transmitter tags were deployed on nesting female green, hawksbill and flatback turtles at major rookeries in Western Australia during the breeding season (October-January) between 2001 and 2018. These provided data on their use of nesting habitats and migration to foraging grounds (Pendoley, 2005; Waayers et al., 2011; Whittock et al., 2016; Thums et al., 2017; Thums et al., 2018; Ferreira et al., 2021; Fossette et al., In Press). Two nesting female hawksbill turtles tagged at a rookery in Timor-Leste that migrated into north-western Australia were also included in the analysis (Fossette et al In Press).
Humpback whales were tagged on three different occasions during their northbound migrations to breeding grounds in north-western Australia, and southbound migrations to feeding grounds in Antarctic waters. Seventeen adult female humpback whales (with dependent calves) were tagged in the Kimberley region during their southbound migration on August and September 2009 (Double et al., 2009, 2010). Humpback whales from both sexes on their northward migration were also tagged off Ningaloo Reef, Western Australia in July 2011 (n = 21) and off James Price Point, Western Australia in July 2008 (n = 6).
Pygmy blue whales were tagged during their northern migration (i.e. migration to wintering grounds in Indonesia) off their feeding grounds in the Perth Canyon (n = 13) in 2009, 2011 (Double et al., 2014) and 2021 (Thums et al. 2022), the Bonney Upwelling region, South Australia in March 2015 (n = 1 F) (Moller et al., 2020), and off Northwest Cape (n = 6) (just north of Ningaloo Reef) in May-June 2019 and 2020 (Thums et al, submitted).
Whale sharks (n = 56) were tagged during the seasonal aggregation at Ningaloo Reef and Shark Bay, Western Australia between 2005-2007 and 2010-2018 (Wilson et al., 2006; Sleeman et al., 2010b; Norman et al., 2016; Reynolds et al., 2017).
For each of the pressure spatial layers we scored each grid cell by the intensity of the pressure (ranging from 0 to 1) or as presence/absence. For layers indicating presence/absence of a pressure (e.g. petroleum titles, acreage releases and aquaculture), spatial data were intersected with a 10 km grid and each grid cell was classified as having a pressure present (1) or absent (0). We considered that the presence of one of these pressures was equivalent to a high intensity value (i.e. 1) because they are a proxy for a range of present and future activities associated with a broad range of threats, such as chemical and artificial light pollution, underwater noise, oil spills, and habitat modification. The values and the numbers of all stressors (presence/absence and intensity) in each grid cell were then summed. Spatial overlap between marine megafauna taxa and threat layers was used to estimate the cumulative taxa-threat intensity overlap in a grid cell. We mapped the cumulative exposure indices (number and intensity) per taxa group to identify areas of high exposure of threatened megafauna to anthropogenic threats.
We identified which pressures would likely interact with each taxon. Then all pressures that were considered to interact with a taxon (Table 1) were overlaid and the intensity values (presence/absence and intensity) and the numbers of all pressures in each grid cell were then summed. Spatial overlap between marine megafauna taxa and pressure layers was used to estimate exposure intensity (EI) and exposure in number (EN). We also mapped the exposure indices (number and intensity) per taxa group to identify areas of high exposure of threatened megafauna to anthropogenic threats.
We then ranked all grid cells by their EI and EN values (exposure intensity and number) from largest to smallest, split the cells encompassing the top 50% of the cumulative distribution (i.e. high exposure) from the bottom 50% to define management priority areas. These area are where high exposure to threats suggests management is needed (EI and EN values equivalent to the top 50% quartiles). We identified which threats were present within management priority areas (high exposure). We also mapped the number of threats in a grid cell within each taxon’s spatial distribution and calculated the proportion of each taxon’s spatial distribution overlapping with one or more co-occurring stressors.
Acknowledgements
This study was conducted as part of AIMS’ North West Shoals to Shore Research Program (NWSSRP) and was supported by Santos as part of the company’s commitment to better understand Western Australia’s marine environment. AIMS acknowledges all the data contributors and co-authors on the project: Luciana C. Ferreira, Michele Thums, Scott Whiting, Mark Meekan, Virginia Andrews-Goff, Catherine R. M. Attard, Kerstin Bilgmann, Mike Double, Fabio Falchi, Michael Guinea, Sharyn Hickey, Curt Jenner, Micheline Jenner, Graham Loewenthal, Luciana Moller, Brad Norman, Kellie Pendoley, Ben Radford, Samantha Reynolds, Jason Rossendell, Tony Tucker, David Waayers, Sabrina Fossette. We acknowledge the INPEX-operated Ichthys LNG Project and Woodside Energy Ltd (Woodside) as Operator for and on behalf of the Browse Joint Venture (BJV) for making data available. AIMS acknowledges the Traditional Owners of Country throughout the northern coast of Western Australia where this NWSSRP work was undertaken. We recognise these People’s ongoing spiritual and physical connection to Country and pay our respects to their Aboriginal Elders past, present and emerging.
References
Double, M. C., V. Andrews-Goff, K. C. S. Jenner, M.-N. Jenner, S. M. Laverick, T. A. Branch, and N. J. Gales. 2014. Migratory Movements of Pygmy Blue Whales (Balaenoptera musculus brevicauda) between Australia and Indonesia as Revealed by Satellite Telemetry. PLOS ONE 9:e93578.
Double, M. C., N. Gales, K. C. S. Jenner, and M.-N. Jenner. 2010. Satellite tracking of south-bound female humpback whales in the Kimberley region of Western Australia. Final Report.
Double, M. C., K. C. S. Jenner, M.-N. Jenner, I. Ball, S. Childerhouse, and S. Laverick. 2011. Satellite tracking of northbound humpback whales (Megaptera novaeangliae) off Western Australia. Draft Final Report - December 2011.
Ferreira, L. C., M. Thums, S. Fossette, P. Wilson, T. Shimada, A. D. Tucker, K. Pendoley, D. Waayers, M. L. Guinea, G. Loewenthal, J. King, M. Speirs, D. Rob, and S. D. Whiting. 2021. Multiple satellite tracking datasets inform green turtle conservation at a regional scale. Diversity and Distributions n/a.
Fossette, S., L. C. Ferreira, S. D. Whiting, J. King, G. Loewenthal, K. Pendoley, T. Shimada, M. Spiers, A. D. Tucker, P. Wilson, and M. Thums. In Press. Movements and distribution of hawksbill turtles in the Eastern Indian Ocean. Global Ecology and Conservation.
Moller, L. M., C. R. M. Attard, K. Bilgmann, V. Andrews-Goff, I. Jonsen, D. Paton, and M. C. Double. 2020. Movements and behaviour of blue whales satellite tagged in an Australian upwelling system. Scientific Reports 10:21165.
Norman, B. M., S. Reynolds, and D. L. Morgan. 2016. Does the whale shark aggregate along the Western Australian coastline beyond Ningaloo Reef? Pacific Conservation Biology 22:72-80.
Pendoley, K. L. 2005. Sea turtles and the environmental management of industrial activities in North West Western Australia. Murdoch University, Perth.
Reynolds, S. D., B. M. Norman, M. Beger, C. E. Franklin, and R. G. Dwyer. 2017. Movement, distribution and marine reserve use by an endangered migratory giant. Diversity and Distributions 23:1268-1279.
Sleeman, J. C., M. G. Meekan, S. G. Wilson, J. J. Polovina, J. D. Stevens, G. S. Boggs, and C. J. Bradshaw. 2010. To go or not to go with the flow: environmental influences on whale shark movement patterns. Journal of Experimental Marine Biology and Ecology 390:84-98.
Thums, M., L. C. Ferreira, K. C. S. Jenner, M. Jenner, D. Harris, A. Davenport, V. Andrews-Goff, M. C. Double, L. Moller, C. R. M. Attard, K. Bilgmann, P. Thomson, and R. McCauley. Submitted. Pygmy blue whale movement, distribution and important areas in the Eastern Indian Ocean. Global Ecology and Conservation.
Thums, M., J. Rossendell, M. Guinea, and L. C. Ferreira. 2018. Horizontal and vertical movement behaviour of flatback turtles and spatial overlap with industrial development. Marine Ecology Progress Series 602:237-253.
Thums, M., D. Waayers, Z. Huang, C. Pattiaratchi, J. Bernus, and M. Meekan. 2017. Environmental predictors of foraging and transit behaviour in flatback turtles Natator depressus. Endangered Species Research 32:333-349.
Waayers, D. A., L. M. Smith, and B. E. Malseed. 2011. Inter-nesting distribution of green Chelonia mydas and flatback turtles Natator depressus at the Lacepede Islands, Western Australia. Journal of the Royal Society of Western Australia 94:59-64.
Whittock, P. A., K. L. Pendoley, and M. Hamann. 2014. Inter-nesting distribution of flatback turtles Natator depressus and industrial development in Western Australia. Endangered Species Research 26:25-38.
Whittock, P. A., K. L. Pendoley, and M. Hamann. 2016. Flexible foraging: Post-nesting flatback turtles on the Australian continental shelf. Journal of Experimental Marine Biology and Ecology 477:112-119.
Wilson, S. G., J. J. Polovina, B. S. Stewart, and M. G. Meekan. 2006. Movements of whale sharks (Rhincodon typus) tagged at Ningaloo Reef, Western Australia. Marine Biology 148:1157-1166.
| Attachment | Size |
|---|---|
| 154.84 KB |