
What's on the menu for flatback turtles?
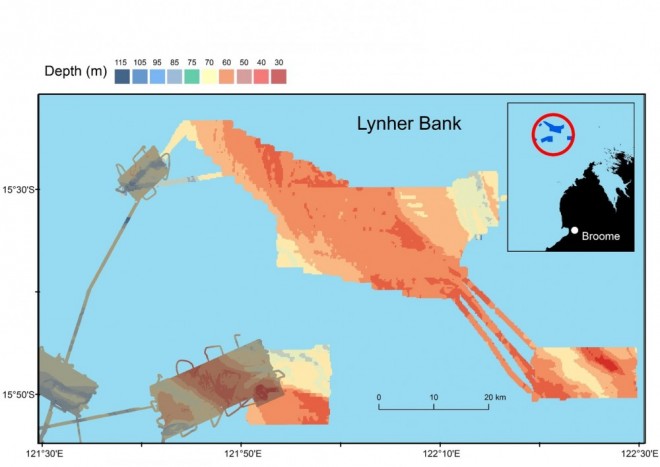
In partnership with the Western Australian Department of Parks and Wildlife (DePaW), Western Australian Marine Science Institution (WAMSI) scientists on the Australian Institute of Marine Science (AIMS) vessel RV Solander recently spent 15 days in the field collecting data to help determine what flatback sea turtles in north-western Australia eat. These turtles are only found in Australia, and this knowledge will help to develop effective management strategies for their conservation. We concentrated our efforts in the vicinity of Lynher Bank (located about 120 nm north of Broome - see map above) because it is a flatback turtle foraging hotspot (see previous article What do flatback turtles in NW Australia eat?). The study area was broken into several parts to allow us to visit areas where turtles spent varying amounts of time foraging, as well as to include areas where detailed data about depth already existed (gray shaded areas on the map).
We did this by collecting:
- samples of creatures that turtles might eat both on the sea floor and in the water column, and
- data needed to build a detailed map of where relevant creatures and communities are found (eg, high resolution sonar data, underwater towed video, and high resolution still images).
What could turtles be eating on the sea floor?
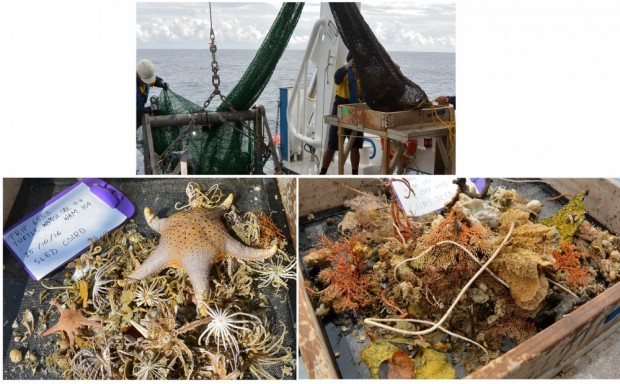
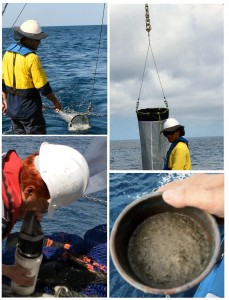
Using a sled dragged along the sea floor (how it works), we collected samples of creatures in 17 locations ranging in depth from 40 to 100 metres. Experts from the Western Australian Museum will analyse the samples to identify each creature in as much detail as possible. Then, scientists from CSIRO will estimate how the diversity of life on the sea floor varies across the study area. If you are wondering what life exists so deep below the waves, above are examples of the mix of creatures we typically found (and watch this video).
We saw the large sea star in the picture to the far left above throughout the north-western section of our study area (watch the video). Also in that picture are many examples of feather stars which were generally very common (watch the video). In certain areas brittle stars were well represented, sometimes in large quantities (watch the video). To the south-west of Lynher Bank, the AIMS towed-video camera found fields of sea anenomes (watch the video). In scattered locations where hard rock exists under the sand, we found gardens of sponges and soft corals.
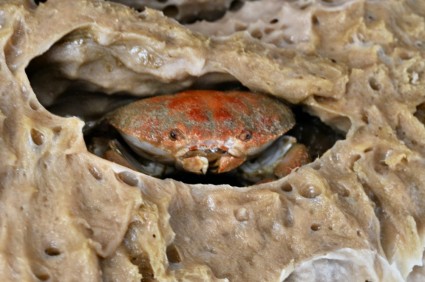
These creatures must anchor themselves to a solid surface or get swept away by the strong tidal currents created by one of the world's largest tidal ranges (up to 5 metres in one day during spring tides). Watch a video of a particularly luxuriant such garden, located on a drowned reef platform discovered during our trip by sonar expert Iain Parnum. These communities provide habitat for many other creatures, which in turn provide food for fish (watch the video) - for example, a family of crabs living inside a large sponge (see above).
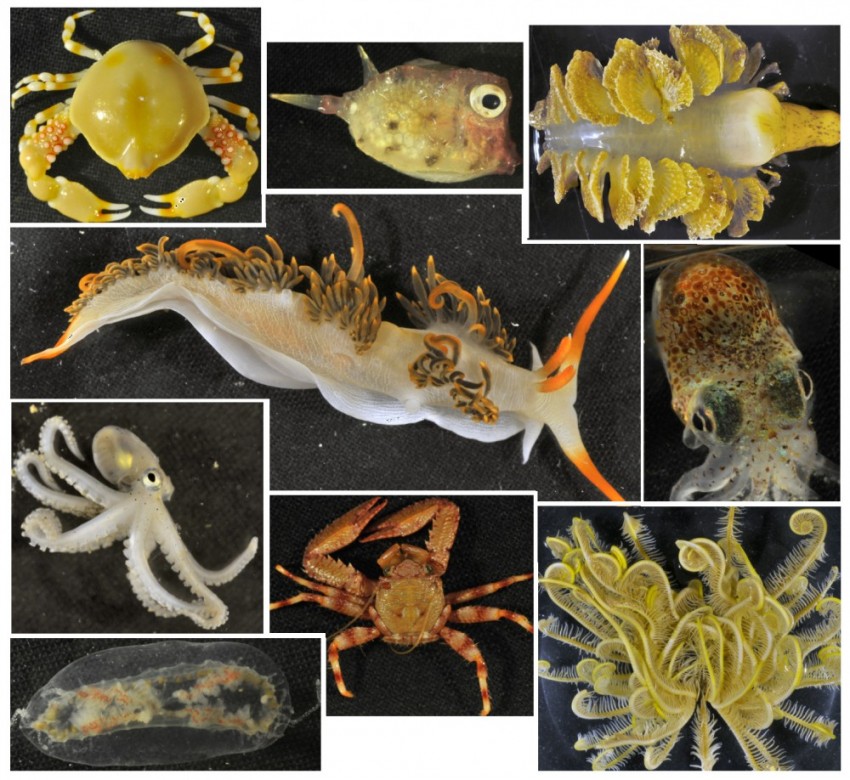
From the sleds, 280 samples were collected and frozen for later stable isotope analysis. This analysis will compare the chemical composition of each sample to that of samples taken from turtles collected during other field trips. For example, if the isotopes found in a seapen are also found in flatback turtle tissues, this suggests that turtles could be eating seapens. Below are examples of creatures we collected that will be tested in this way.
What could turtles eat in the water column?
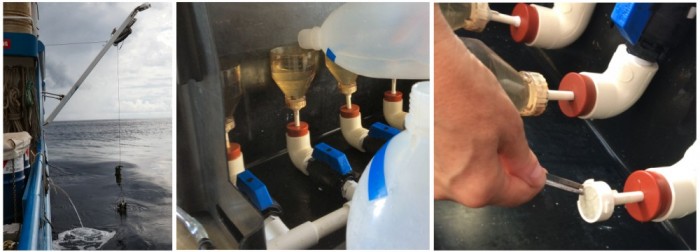
We took samples from the water column in two ways: by using fine-mesh plankton nets, and by filtering water collected in bottles attached to an instrument lowered into the water by the ship's winch.
The fine-mesh plankton net was towed through the water at slow speed (~2 knots) to collect creatures that live in the water column at 17 locations (see left). The sample from each of these tows was frozen for later isotope analysis. We found plenty of jellies and siphophores in the waters of our study area. Both of these are suspected food sources for flatback sea turtles.
We measured the salinity, temperature and depth of the water prior to collecting each bottom sample with the sled using a CTD. At the same time, we collected water samples at the surface and a bit deeper by attaching niskin bottles to the CTD (see picture below). The water collected was then filtered to obtain samples of the tiny organisms living in the water column.
Mapping organisms and communities using underwater video
Sleds are time consuming to collect and process, and only so many specimens can be preserved for later analysis. To discover what lives on the sea floor across a larger area, we also took underwater video and still photos just above the sea floor (how it works) along a series of 60+ 1.5 km long transects. A live video feed on deck enabled an ecologist to record what she was seeing in real time. This produced a series of points along each transect where the type of organism and type of community was recorded. The map below shows the resulting data for organism classes: anenome, bryozoan (lace coral), feather star, sea star, hydroid, seapen and urchins.
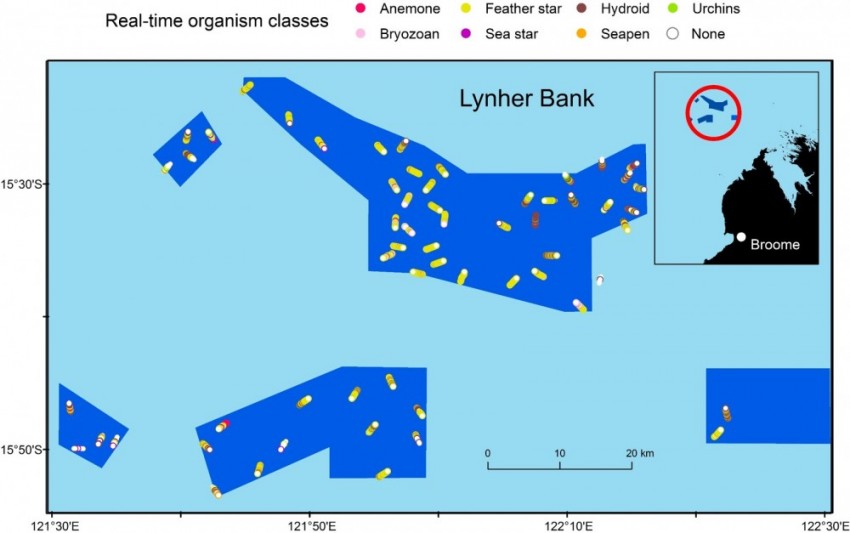
You can see on the map that feather stars (yellow) were widely distributed, while hydroids (brown) were most often seen north-east of Lynher Bank (top right of the study area). The field of anenomes mentioned above is shown by the bright pink dot at the bottom left. Relatively few dots on the map are white because most transects were well populated with organisms.
In contrast, the map below shows where communities of Alcyons (soft corals in general), Gorgonians (soft corals that look like fans), Whips (soft corals that are long and thin like a whip) and sponges were found across the study area. D stands for dense, M for medium and S for sparse. Many dots on this map are white because these communities only occurred in the few areas where solid rock existed under the sand (as mentioned above).
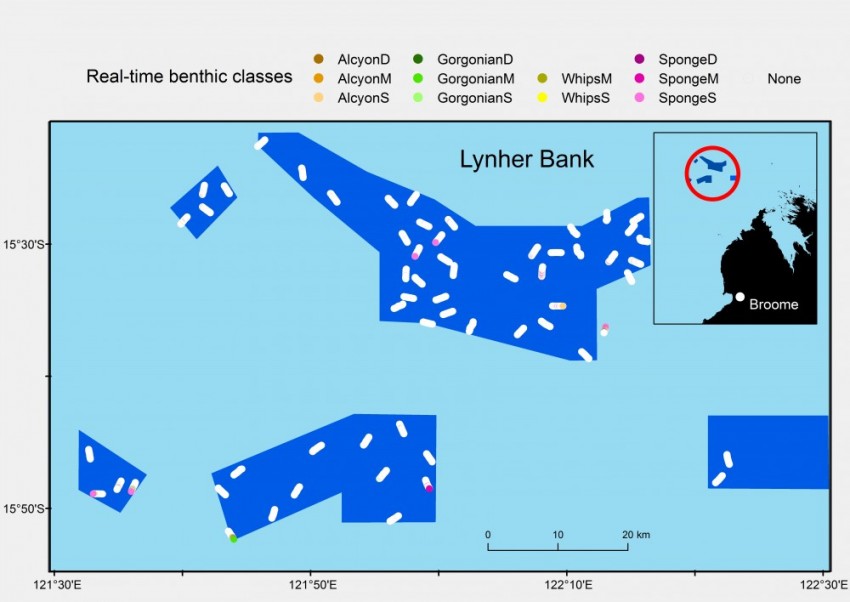
Still photos taken along these transects will be analyzed by ecologists at AIMS to identify the species and groups of organisms present. These data will be used with the detailed bathymetry data we collected using sonar to predict what exists at locations across the study area that we did not survey. This can be compared to data about where turtles spent the most time foraging.
What else did we find?
The ocean is an amazing place! The AIMS towed video camera also captured:
- A zebra shark cruising the sea floor with a trevally (watch the video),
- Two sting rays (watch the video), and
- A giant ray with fins like a shark - giant guitarfish (watch the video).
Watch all the videos about the trip:
In case you missed any, here is a list of videos from the trip:
- What lives on the sea floor in the low light depths of the 'twilight' zone?
- Watch out for stinging tentacles 70 metres under the sea!
- Zebra shark and trevally cruise the sea floor 80 metres beneath the waves
- Follow a fish shoal through sponge and soft coral gardens 100 metres below the waves
- See if you can spot the two stingrays cruising the ocean floor offshore from NW Australia
- See gorgeous bejewelled sea star Pentaceraster gracilis close-up and in its underwater habitat
- Watch feather stars 'walk' on their 'knees' in a dense, ghostly carpet on the sea floor
- Can you figure out how these brittle stars are feeding on the sea floor?
- What looks like a shark but is actually a ray?
- See the soft coral-sponge laden drowned platform reef discovered by WAMSI scientist Ian Parnum
- Watch sediment plumes churned up by currents from a 5 m tidal range from the deck of RV Solander
- Scientists on the RV Solander discover what's on the sea floor using a sled
- Surveying marine habitats too deep or too dangerous for SCUBA with towed underwater video